Export API Builder logs into a data store
7 minute read
This document describes how to export Logs from an API Builder application or service into a data store.
Introduction
The generation of API Builder applications is a simple process with the help of the API Builder CLI tool.
Some users may want to run the application and use a Business Intelligence (BI) tool so that they can export logs into a third-party party data store (DS).
This document provides the technical requirements and an example of how to scaffold and run an API Builder application or service and export its logs into Splunk.
Prerequisites
Tools to be installed and prerequisites:
- API Builder Command Line Interface (CLI) - Refer to the Getting Started With API Builder. Once API Builder CLI is installed, you can use it to create a new project and start the API Builder project.
- Docker - The installation of Docker depends on the specific operating system. For additional information on how to install Docker and its supported operating systems, refer to the Docker installation documentation.
- Dockerize Application - Refer to Dockerize API Builder Application for detailed information on to dockerize an application or service. Read the documentation carefully and prepare to run your service within Docker. When running your service in a container, it is often desirable to have the configuration set at runtime and to read parameter values from the environment rather than relying on static values**.**
- Research BI tools - Research BI tools and 3rd party data stores. For example, Splunk, Elastic, and so forth.
Note
For additional resource information, refer to the Docker getting started tutorial, Dockerizing a Node.js web app, and docker-node.Documentation and resources
Useful resources on how to use the product:
- API Builder Documentation
- Axway Appcelerator Youtube Channel
- Appcelerator Blog
- Docker Documentation
- Configure logging drivers in Docker
General description of the integration process
When you create a service using API Builder, you may want to integrate the service with an existing monitoring, audit, or BI system.
While there are several different ways to integrate your service with an existing BI system, this document describes integration with Splunk. The same integration principles that apply to Splunk are also applicable to other aggregators such as Elastic, Awslogs, Gcplogs, and so forth.
Logs export using Docker
The BI tool is a platform for operational intelligence. The software lets you collect, analyze, and act upon the untapped value of big data that your technology infrastructure, security systems, and business applications generate. It gives you insights to drive operational performance and business results. For information on the API Builder logging strategy, refer to Logging. For information on debugging and setting the logging for your application or service, refer to Debugging.
Configure logging drivers
Docker includes multiple logging mechanisms to help you capture logging information from running containers and services. These mechanisms are called logging drivers.
Each Docker daemon has a default logging driver, which each container uses unless you configure it to use a different logging driver.
In addition to using the logging drivers included with Docker, you can also implement and use logging driver plugins. Logging driver plugins are available in Docker 17.05 and higher.
If the logging driver has configurable options, you can set them in the daemon.json file as a JSON array with the log-opts key. The following example sets two configurable options in the json-file logging driver:
{
  "log-driver": "json-file",
  "log-opts": {
    "labels": "production_status",
    "env": "os,customer"
  }
}
To find the current default logging driver for the Docker daemon, run the docker info command and search for Logging Driver. You can use the following command on Linux, macOS, or in PowerShell on Windows:
docker info | grep 'Logging Driver'

Logging Driver: json-file
Note
Read the following documentation and make the configuration changes: Configure logging drivers and Docker JSON File logging driver.Splunk logging driver
Splunk makes it simple to collect, analyze and act upon the untapped value of the big data generated by your technology infrastructure, security systems, and business applications, and gives you the insights to drive operational performance and business results.
The splunk logging driver sends container logs to the HTTP Event Collector in Splunk Enterprise and Splunk Cloud.
You can configure Docker logging to use the splunk driver by default or on a per-container basis.
The common way to use the splunk driver as the default logging driver is to set the log-driver and log-opts keys to appropriate values in the daemon.json configuration file and restart Docker. For example:
{
  "log-driver": "splunk",
  "log-opts": {
    "splunk-token": "",
    "splunk-url": "",
    ...
  }
}
The daemon.json file is located in the /etc/docker/ directoryon Linux hosts or in the C:\ProgramData\docker\config\daemon.json directory on Windows Servers. For more information about configuring Docker using the daemon.json file, see daemon.json.
To configure the splunk driver for a specific container, use the --log-driver and log-opt command-line flags with the docker run command:
docker run --log-driver=splunk --log-opt splunk-token=VALUE --log-opt splunk-url=VALUE ...
Note
For helpful information about the Splunk logging driver, refer to Splunk logging driver.Run Splunk via Docker
- Run the following command to pull the latest version of the Splunk Enterprise image:
docker pull splunk/splunk
- Run the Docker image:
docker run -d -e "SPLUNK_START_ARGS=--accept-license" -e "SPLUNK_USER=root" -p "8000:8000" splunk/splunk
- Access the Splunk instance with a browser by using the Docker machine IP address and Splunk Web port. For example:
http://localhost:8000Note
For additional resources information, refer to Docker/Splunk Enterprise.
Splunk HTTP event collector
The Splunk HTTP Event Collector (HEC) enables you to send data to Splunk Enterprise and Splunk Cloud. HEC lets you send data, application logs, and metrics over HTTP (or HTTPS) directly to Splunk Enterprise or Splunk Cloud from your application. HEC operates with tokens, which means you do not need to embed Splunk Enterprise or Splunk Cloud credentials in your application or supporting files.
Note
Additional information is available at: How HTTP Event Collector works, Overview of Splunk logging for JavaScript and Bunyan stream for HTTP Event Collector and Splunk-JavaScript-logging.Setup Splunk server
Now, we will set up the Splunk server with basic definitions in a local environment using the Docker Splunk logging drive and the HTTP event collector.
- Pull the Splunk image from the Docker hub as follow:
docker pull splunk/splunk
- Check the Splunk image as follows:
docker images | grep splunk
- Start the Splunk server and bind it to the service port using the following command:
docker run -d -e "SPLUNK_START_ARGS=--accept-license" -e "SPLUNK_USER=root" -p "8000:8000" -p "8088:8088" splunk/splunk
- Navigate to
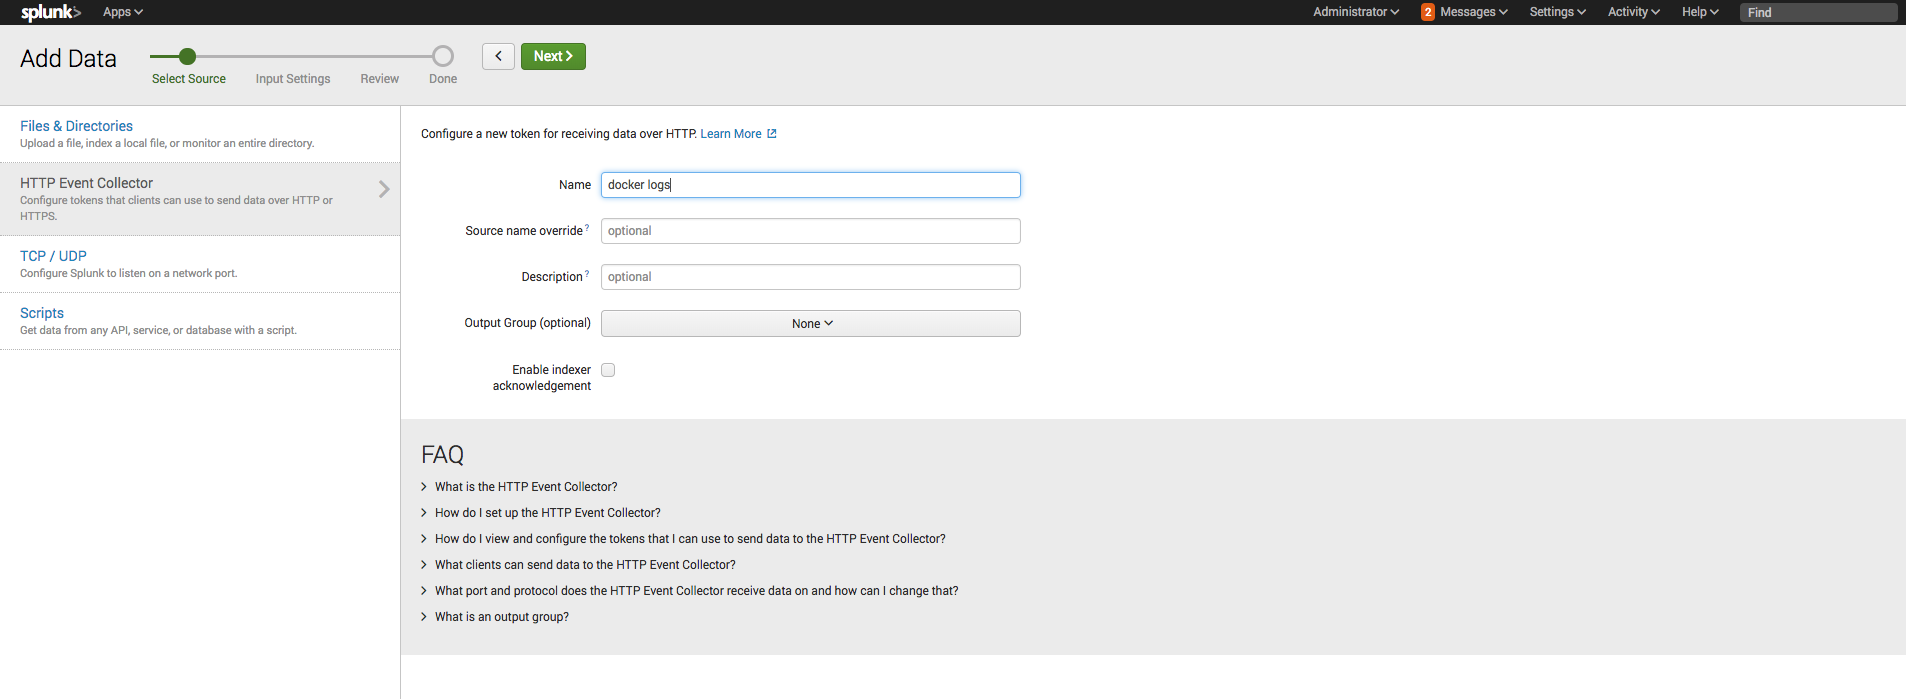
https://localhost:8000/in your browser and verify that the Splunk server is up. - Go to Settings > Data inputs > HTTP Event Collector > Add new.
- Enter a name and select the Next button.
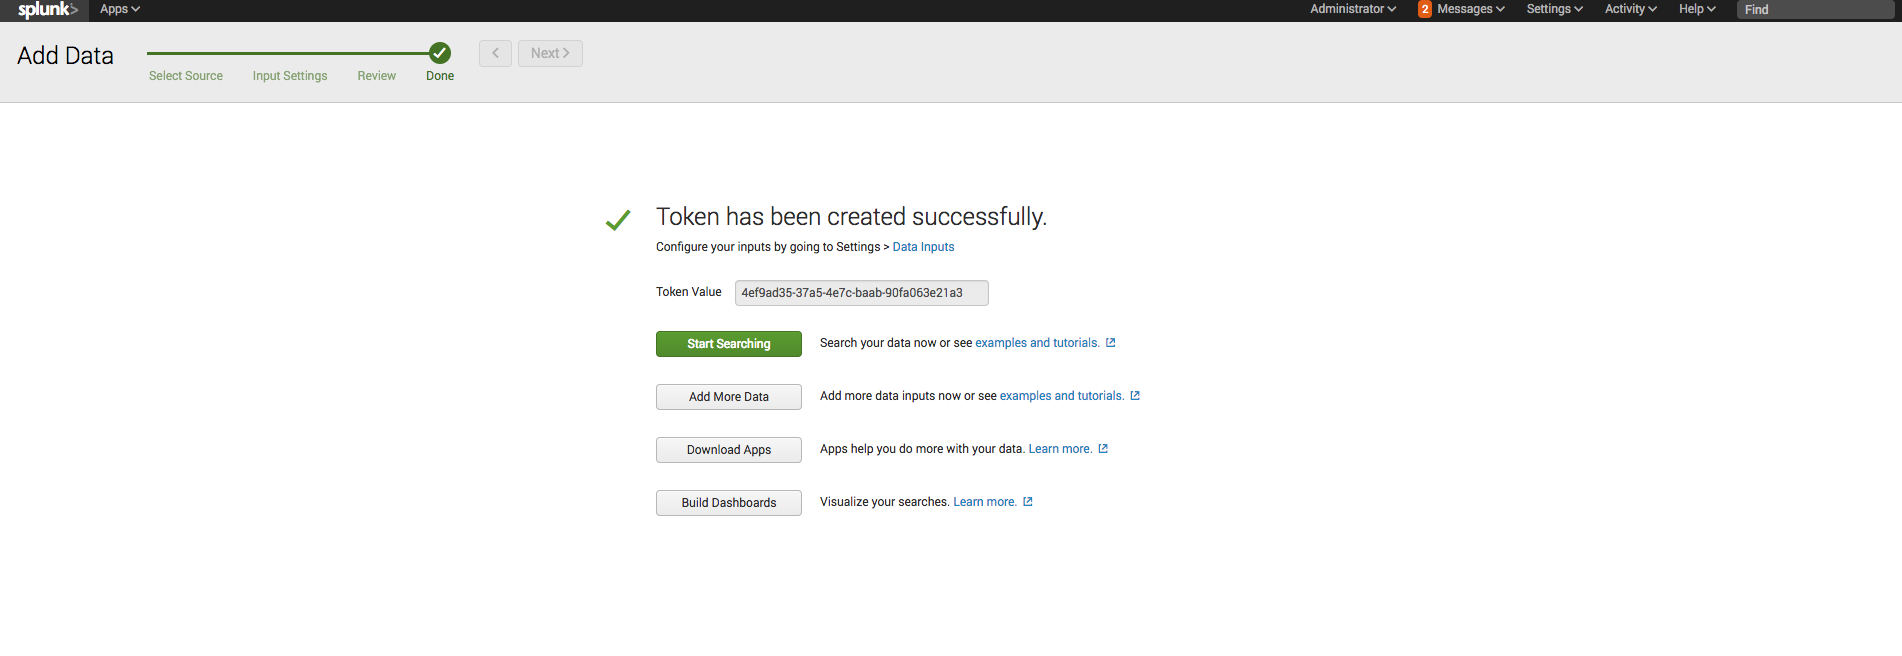
- Verify that you that have successfully generated a Token.
- Copy and save the Token.
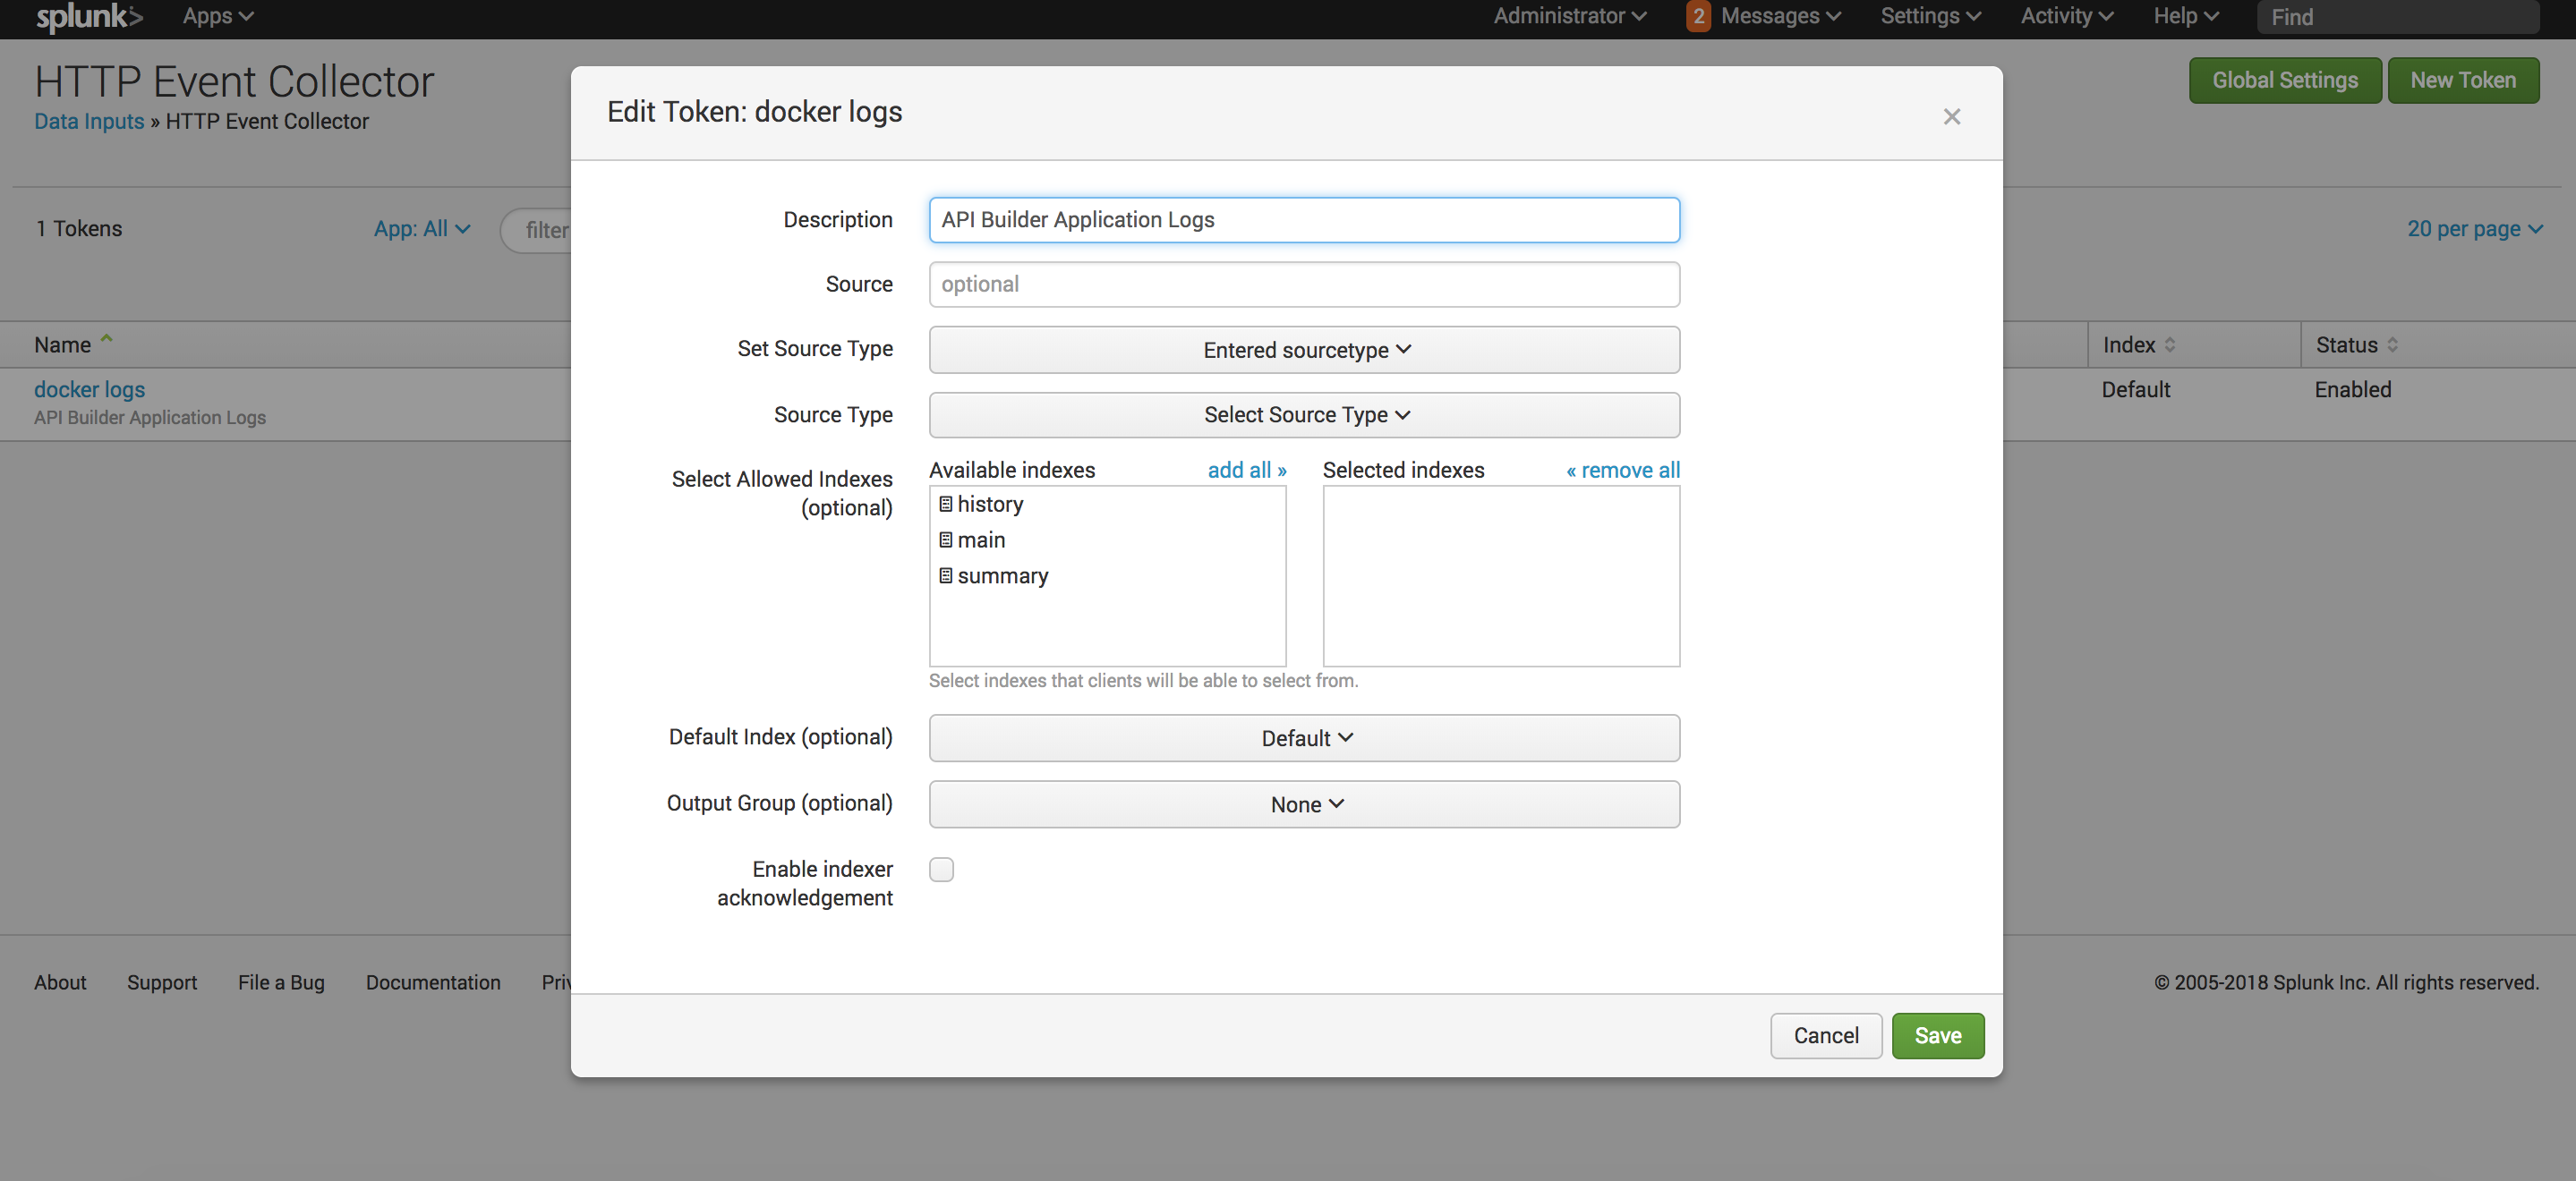
- Navigate to Settings/Data inputs/ HTTP Event Collector and to see your Docker logs.
- Click to Global settings button and Enable button and to find HTTP Port Number.
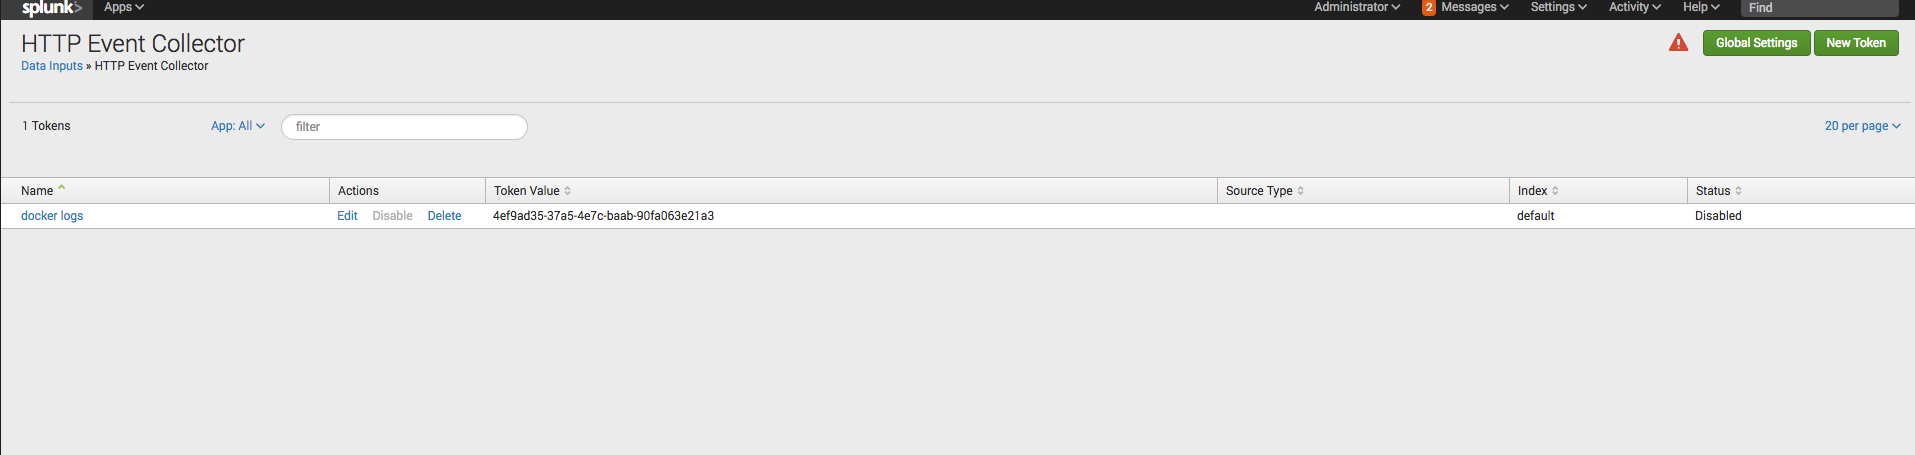
- Click on the Docker logs edit button and leave the default settings.
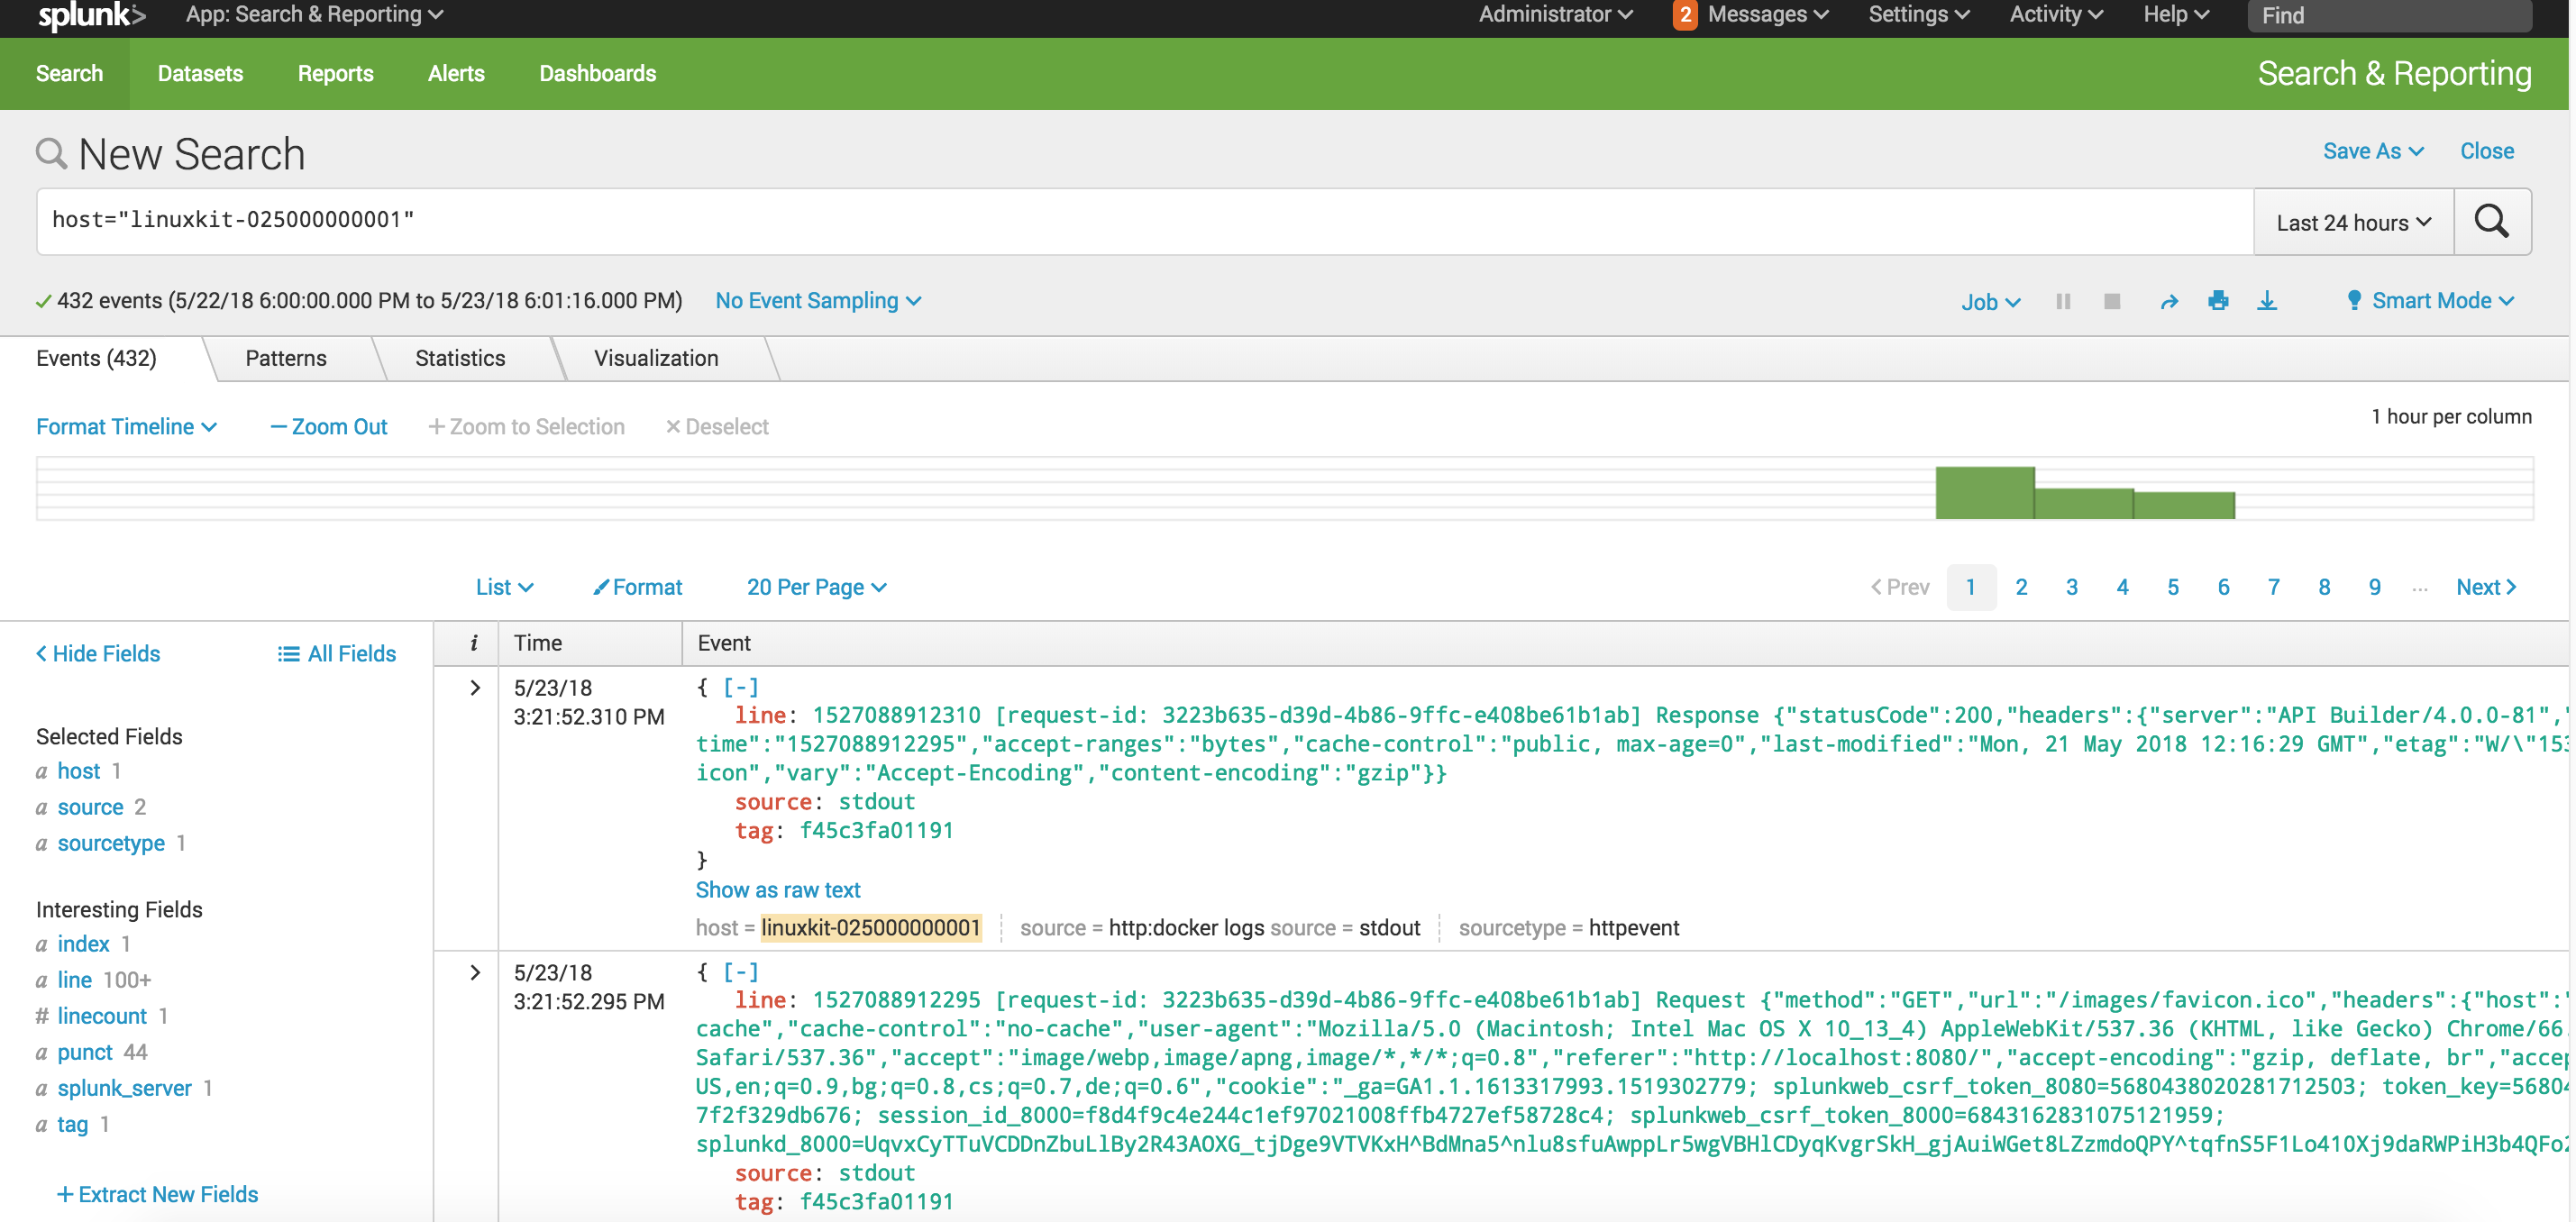
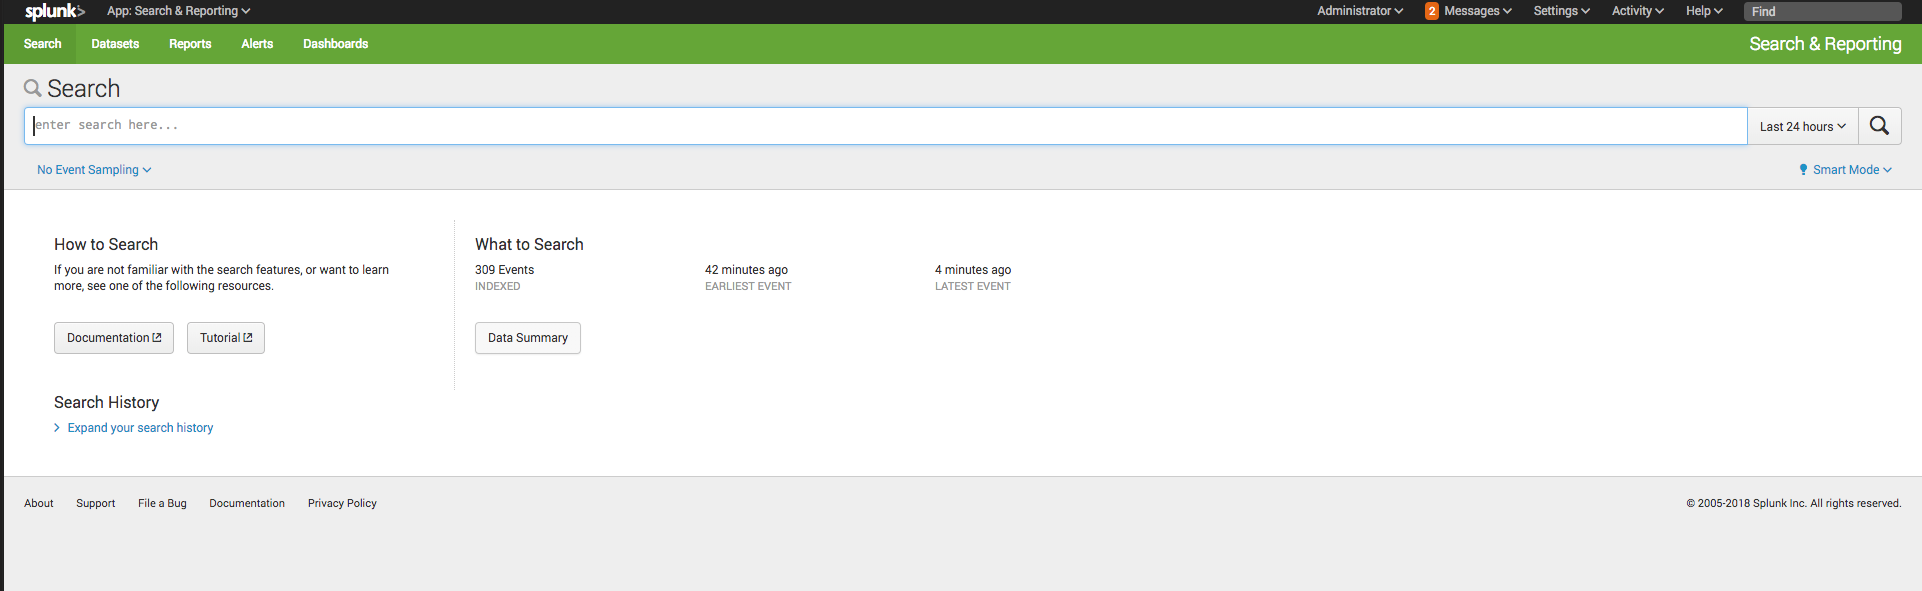
- If you navigate to the App: Search & Reporting page, the following UI will be displayed.
- Once you have the Splunk container running and have set up everything in the Splunk Web, you are ready to run the application container via Splunk. You need to set the application container to the same port that you used for binding in the previous command. For the
splunk-url, you need to use your IP address. TheService-Imageshould be the image name that you already built in your API Builder service. Please use the below command:
docker run -d -p 8080:8080 --log-driver=splunk --log-opt splunk-url=http://<IP>:8088 --log-opt splunk-token=<TOKEN> --log-opt splunk-insecureskipverify=true <Service-Image>
- Verify that you are receiving your application logs in the Splunk Web UI. If everything works correctly, you will automatically receive all your application logs in the Splunk Web UI.
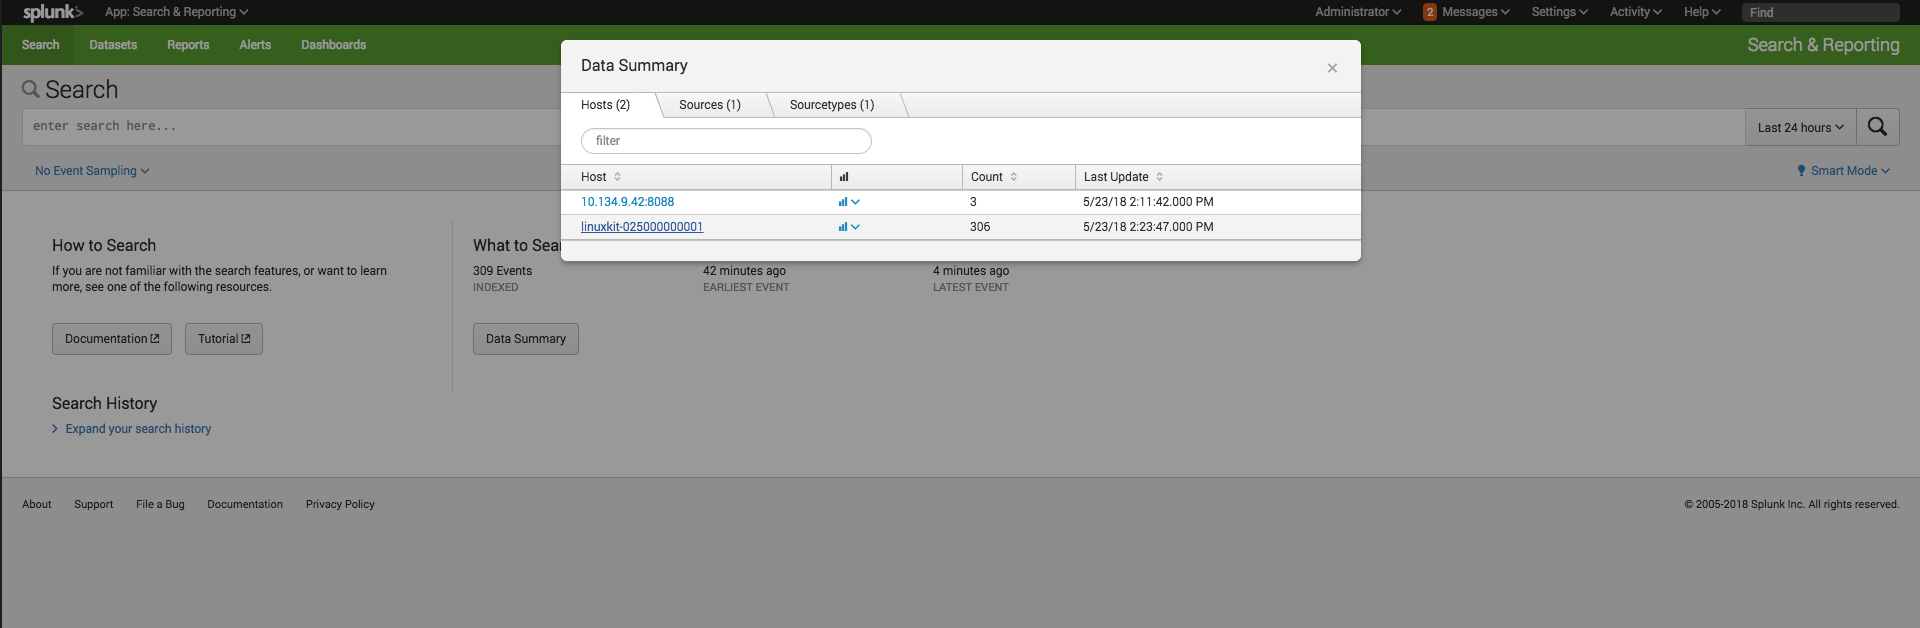 The Logs imported into Splunk will be displayed as in the following examples.
Example one:
The Logs imported into Splunk will be displayed as in the following examples.
Example one:
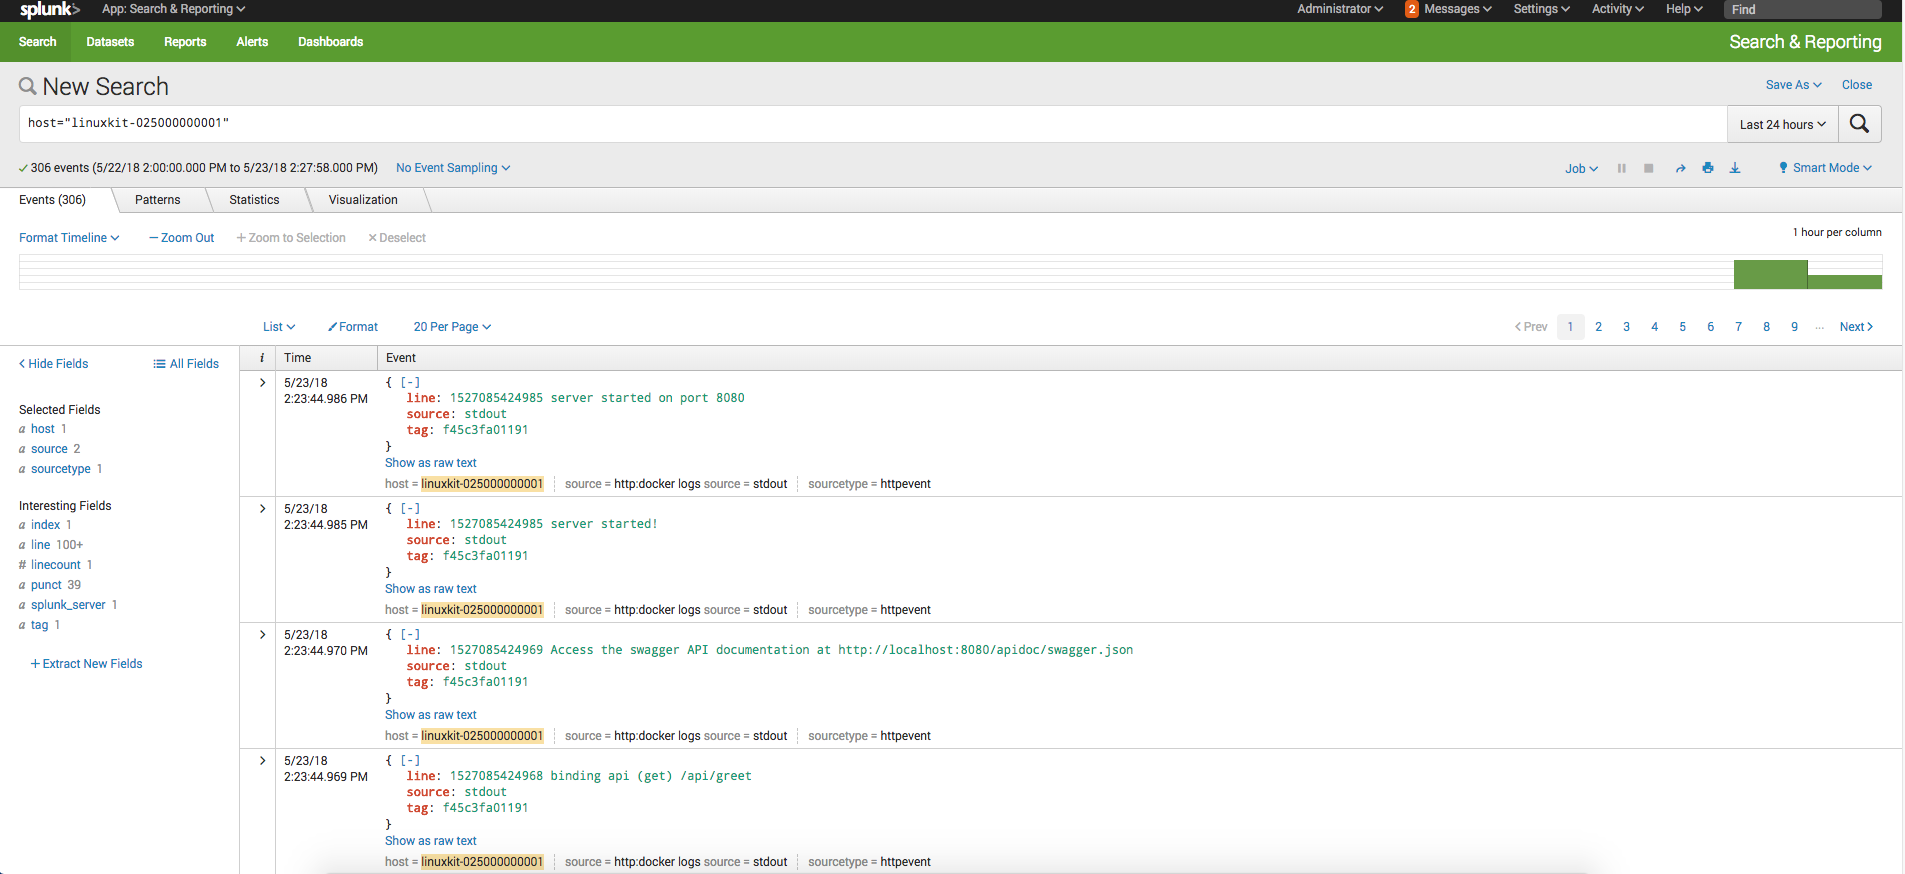 Example two: