Debugging
3 minute read
Application logging
The first step to debugging your application is to enable an appropriate level of logging. API Builder logs to the terminal console window, and the logging can be controlled by editing conf/default.js (search for “logLevel”), or by setting an environment variable LOG_LEVEL. If you encounter a problem with API Builder, you should inspect the terminal console window. If necessary, decrease the logging level to “trace” to gather more information.
Note
For more information on logging, please see this guide.The following levels are listed below from most-verbose to least-verbose. In API Builder, messages are logged at specific levels according to a fixed log level. When you set logging to a specific level, messages at that level and higher will be logged.
| Log level | |
|---|---|
| trace | Detailed verbose logging. |
| debug | Assists with debugging, especially Flows. |
| info | Mostly, request/response logging. |
| warn | Warning messages. |
| error | Error messages. |
| fatal | Fatal messages. |
| none | Disable logging. |
While in development, you may want to log at “debug” level to assist in debugging flows. However, in production, you will want much less logging, e.g. info or higher. To set your logging, edit conf/default.js and change the logLevel .
// conf/default.js

// Log level of the application. Can be set to (in order of most-verbose to
// least): trace, debug, info, warn, error, fatal, none
logLevel: process.env.LOG_LEVEL || 'info',
LOG_LEVEL environment variable
You can set the API Builder log level via the LOG_LEVEL environment variable from the console, without having to edit conf/default.js.
Note
For more information about using environment variables within your application and securing your application, please see Environmentalization.On bash
LOG_LEVEL=trace npm start
On Windows
SET LOG_LEVEL=trace
npm start
On Docker
If you are deploying API Builder using Docker.
docker run -e LOG_LEVEL=trace
Additional logging
If changing the logging level (see above) does not yield enough information, sometimes there are ways to enable additional module-specific logging. Some modules use an independent logging mechanism and different environment variables. Examples are given using the bash style.
DEBUG environment variable
Many modules use the Node.js debug package (see for more information), which can be controlled using the DEBUG environment variable. For example, Express.js.
DEBUG=express:router npm start
Module @axway/api-builder-plugin-dc-mssql
The Microsoft SQL Server plugin uses knex.
DEBUG=knex:* npm start
Module @axway/api-builder-plugin-dc-mysql
The MySQL plugin uses mysql.
DEBUG=knex:* npm start
Module @axway/api-builder-plugin-dc-oracle
The Oracle plugin uses oracledb and it has their own debugging.
DPI_DEBUG_LEVEL=64 npm start
Using a debugger
Sometimes, debugging can yield valuable information. In particular, if you are developing custom API or writing your own flow-nodes using the API Builder SDK, it is an invaluable tool. You can use a variety of debugging / coding environments. However, the Chrome Debugger is most straight forward as you probably already have it installed. To launch Node.js in debug mode, use the –inspect-brk flag.
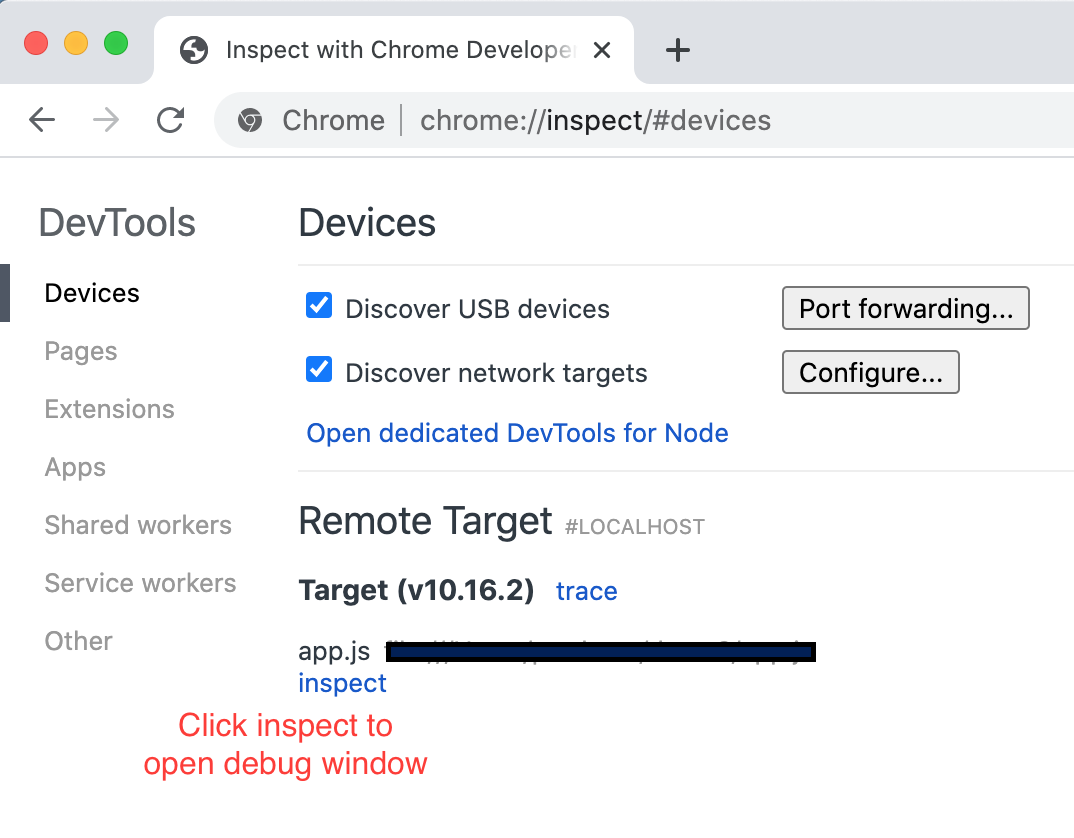
node --inspect-brk .
This will launch a Node.js process and listen for a debugging client. In Chrome, navigate to chrome://inspect/#devices.
Note
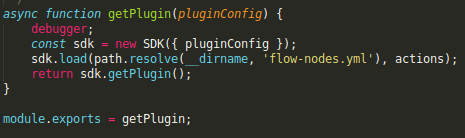
Attaching to the debug process could differ based on development environment you use. This example uses Chrome, but there are alternatives. For example VS Code, which we would also recommend (just turn on auto-attach feature, then put your breakpoints in the code, then run the app as explained earlier). For more information on this see Node.js debugging in VS Code guide.Breakpoints
There are a variety of ways to set breakpoints. You can set them manually in the debugger, or by inserting the “debugger” statement into your code before running the application, e.g.